В этом упражнении вам необходимо написать функцию qr_iteration, которая будет выполнять один шаг QR-итерации.
Входные данные: - A_k: матрица, которую нужно привести к треугольной форме
Выходные данные: - A_{k+1}: матрица, к которой применена одна итерация QR-алгоритма
def qr_iteration(A):"""Perform one step towards Schur form using QR iteration"""return A
import numpy as npimport matplotlib.pyplot as pltfrom matplotlib.animation import FuncAnimationfrom matplotlib import animationfrom tqdm.auto import tqdmfrom PIL import Imageimport requestsfrom io import BytesIO# ----------------------------# Parameters and Setup# ----------------------------N_FRAMES =120# total number of framesHOLD_FRAMES =10# frames to hold original imagesFPS =20FILENAME ="matrix_animation.mp4"DPI =200MATRIX_SIZE =128# size of the matrices# Style parametersLABELS_FONTSIZE =10FIGSIZE = (8, 4) # Adjusted for 2 images instead of 3def load_image_as_matrix(url, size=(MATRIX_SIZE, MATRIX_SIZE)):"""Load and preprocess image from URL into a matrix""" response = requests.get(url) img = Image.open(BytesIO(response.content)).convert('L') # Convert to grayscale img = img.resize(size)return np.array(img)# Load two imagesurl0 ="https://raw.githubusercontent.com/MerkulovDaniil/optim/refs/heads/master/assets/Notebooks/fmin_hopfield_1.webp"url1 ='https://raw.githubusercontent.com/MerkulovDaniil/optim/refs/heads/master/assets/Notebooks/fmin_hopfield_0.webp'# Generate matrices from imagesA1 = load_image_as_matrix(url0)A2 = load_image_as_matrix(url1)# Store initial matrices for referenceA1_init = A1.copy()A2_init = A2.copy()def qr_iteration(A):"""Perform one step towards Schur form using QR iteration""" Q, R = np.linalg.qr(A)return R @ Q# ----------------------------# Set up the plot# ----------------------------fig, (ax1, ax2) = plt.subplots(1, 2, figsize=FIGSIZE, layout='tight')# Initial heatmapsim1 = ax1.imshow(A1, cmap='gray')im2 = ax2.imshow(A2, cmap='gray')# Set titlesax1.set_title('Рус', fontsize=LABELS_FONTSIZE)ax2.set_title('Ящер', fontsize=LABELS_FONTSIZE)plt.tight_layout()# Remove ticksfor ax in [ax1, ax2]: ax.set_xticks([]) ax.set_yticks([])# Animation update functiondef update(frame):global A1, A2# Hold original images for HOLD_FRAMES framesif frame < HOLD_FRAMES:return im1, im2# After hold period, perform Schur iterations A1 = qr_iteration(A1) A2 = qr_iteration(A2) im1.set_array(A1) im2.set_array(A2)return im1, im2# ----------------------------# Create and save the animation# ----------------------------print("Generating animation...")ani = FuncAnimation(fig, update, frames=N_FRAMES, interval=100, blit=True)# Optimize video writingwriter = animation.FFMpegWriter( fps=FPS, metadata=dict(artist='Matrix Animation'), bitrate=-1, codec='h264', extra_args=['-preset', 'ultrafast', '-crf', '28', '-pix_fmt', 'yuv420p', '-tune', 'animation'])with tqdm(total=100, desc="Saving animation") as pbar: plt.tight_layout() ani.save(FILENAME, writer=writer, dpi=DPI, progress_callback=lambda i, n: pbar.update(100/n))plt.close()
Generating animation...
/var/folders/7m/3rbdnx5n5sz625f3l87m91cc0000gn/T/ipykernel_55670/3608339251.py:100: UserWarning: The figure layout has changed to tight
  plt.tight_layout()
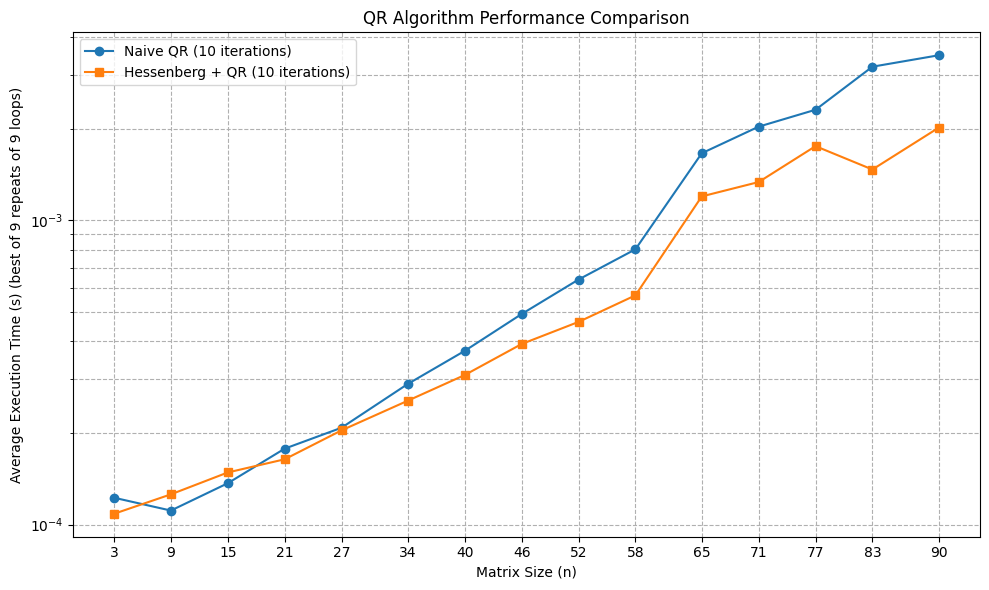
QR алгоритм + форма Гессенберга
В этом упражнении мы сравним классический QR-алгоритм и QR-алгоритм с использованием формы Гессенберга. Вам необходимо реализовать две функции: naive_qr_iterations и hessenberg_qr_iterations.
def naive_qr_iterations(A, iterations):"""Performs a fixed number of naive QR iterations.""" A_k = A.copy()for _ inrange(iterations):return A_k # Return the result to ensure computation isn't optimized awaydef hessenberg_qr_iterations(A, iterations):"""Performs Hessenberg reduction and then a fixed number of QR iterations."""# 1. Reduce to Upper Hessenberg form H =# 2. Perform QR iterations on the Hessenberg matrix H_k = H.copy()for _ inrange(iterations):return H_k # Return the result
import numpy as npimport scipy.linalgimport timeitimport matplotlib.pyplot as pltfrom tqdm import tqdm # Optional: for progress bar# --- Configuration ---# Matrix sizes to testn_values = np.linspace(3, 90, 15, dtype=int)# Number of QR iterations to perform within the timed function# Note: This is *not* for full convergence, but to represent the iterative part.# The main benefit of Hessenberg is reducing the cost *per iteration*.NUM_ITERATIONS =10# timeit parameters (mimicking -n 5 -r 5)TIMEIT_NUMBER =9# Number of executions within one repeat loopTIMEIT_REPEAT =9# Number of times to repeat the timing loop# --- Algorithm Implementations ---def naive_qr_iterations(A, iterations):"""Performs a fixed number of naive QR iterations.""" A_k = A.copy()for _ inrange(iterations): Q, R = np.linalg.qr(A_k) A_k = R @ Q # Note: RQ instead of QR for eigenvalue algorithmreturn A_k # Return the result to ensure computation isn't optimized awaydef hessenberg_qr_iterations(A, iterations):"""Performs Hessenberg reduction and then a fixed number of QR iterations."""# 1. Reduce to Upper Hessenberg form H = scipy.linalg.hessenberg(A, calc_q=False) # We only need H for iterations# 2. Perform QR iterations on the Hessenberg matrix H_k = H.copy()for _ inrange(iterations): Q, R = np.linalg.qr(H_k) H_k = R @ Q # Note: RQ instead of QR for eigenvalue algorithmreturn H_k # Return the result# --- Timing Loop ---naive_times = []hessenberg_times = []print(f"Starting timing comparison for n = {n_values}")print(f"Using {NUM_ITERATIONS} QR iterations.")print(f"Timeit settings: number={TIMEIT_NUMBER}, repeat={TIMEIT_REPEAT}")for n in tqdm(n_values, desc="Matrix Sizes"):# Create a random matrix for this size matrix = np.random.rand(n, n)# --- Time Naive QR --- setup_code =f"""import numpy as npfrom __main__ import naive_qr_iterations, matrix, NUM_ITERATIONS# Ensure matrix is defined in the setup scope for timeitmatrix_copy = matrix.copy() """ stmt_code ="naive_qr_iterations(matrix_copy, NUM_ITERATIONS)"# timeit.repeat runs the setup once per repeat, then the statement 'number' times.# It returns a list of total times for each repeat loop. results_naive = timeit.repeat( stmt=stmt_code, setup=setup_code, number=TIMEIT_NUMBER, repeat=TIMEIT_REPEAT )# Get the best time and average it over the number of executions per loop# This mimics the typical output of %timeit (best of 'r' repeats) best_time_naive =min(results_naive) / TIMEIT_NUMBER naive_times.append(best_time_naive)# --- Time Hessenberg + QR --- setup_code_hess =f"""import numpy as npimport scipy.linalgfrom __main__ import hessenberg_qr_iterations, matrix, NUM_ITERATIONS# Ensure matrix is defined in the setup scope for timeitmatrix_copy = matrix.copy() """ stmt_code_hess ="hessenberg_qr_iterations(matrix_copy, NUM_ITERATIONS)" results_hess = timeit.repeat( stmt=stmt_code_hess, setup=setup_code_hess, number=TIMEIT_NUMBER, repeat=TIMEIT_REPEAT )# Get the best time and average it best_time_hess =min(results_hess) / TIMEIT_NUMBER hessenberg_times.append(best_time_hess)# Optional: print intermediate results# print(f"n={n}: Naive Time = {best_time_naive:.6f}s, Hessenberg Time = {best_time_hess:.6f}s")print("\nTiming complete.")print("Naive Times:", naive_times)print("Hessenberg Times:", hessenberg_times)# --- Plotting Results ---plt.figure(figsize=(10, 6))plt.plot(n_values, naive_times, 'o-', label=f'Naive QR ({NUM_ITERATIONS} iterations)')plt.plot(n_values, hessenberg_times, 's-', label=f'Hessenberg + QR ({NUM_ITERATIONS} iterations)')plt.xlabel("Matrix Size (n)")plt.ylabel(f"Average Execution Time (s) (best of {TIMEIT_REPEAT} repeats of {TIMEIT_NUMBER} loops)")plt.title("QR Algorithm Performance Comparison")plt.legend()plt.grid(True, which="both", ls="--")plt.yscale('log') # Use log scale for time as it grows quicklyplt.xticks(n_values) # Ensure ticks are at the tested n valuesplt.tight_layout()plt.show()
Starting timing comparison for n = [ 3  9 15 21 27 34 40 46 52 58 65 71 77 83 90]
Using 10 QR iterations.
Timeit settings: number=9, repeat=9